

You have a promising drug or intervention and you run a randomized study, but you miss your primary endpoint. Is it possible your intervention still works?
Yes.
Can looking at secondary endpoints help you figure out if that's the case?
Again, the answer is yes.
But you have to be smart about it. You have to apply critical thinking skills to the question.
Consider two cases. Case 1:
You make a new cancer drug. You test against the best available care and the primary endpoint is PFS. Your response rate is 20 points higher than the control arm (stat sig). Your PFS is numerically 3 months longer but the p-value is 0.06. Your overall survival is trending favorably. Your drug has very little side effects, and is oral versus the IV control arm. Time to next treatment is prolonged, and quality of life is favorable.
Does your drug actually work? Yes, probably. Look at the story that's being told. A narrow miss on the primary. Multiple consistent secondaries. Why did you miss? Was the event rate in the control arm lower than anticipated? Is it possible there's a effect modifier, a biomarker? Totally worth exploring these ideas further.
Should you be required to replicate your finding? Use real world evidence to bolster your finding? This is a debate for another day. But reasonable people will agree you have a flash in the pan.
Case 2:
Now, what if your primary endpoint is Stone Cold negative? Not just a little negative but the hazard ratio is essentially 1.
Then you look at a secondary endpoint that is actually a sub-component of the primary endpoint. That's going the right direction— borderline stat sig.
But what is the shape of the curve? Is it consistent or does it wobble?
If the primary is Stone Cold negative and the secondary is erratic, could your treatment still work? Maybe, but the far more likely possibility is you have fooled yourself. You may even fool others too. But, as a wise man once said, you'll be unable to fool everyone.
Take a look at MCED.
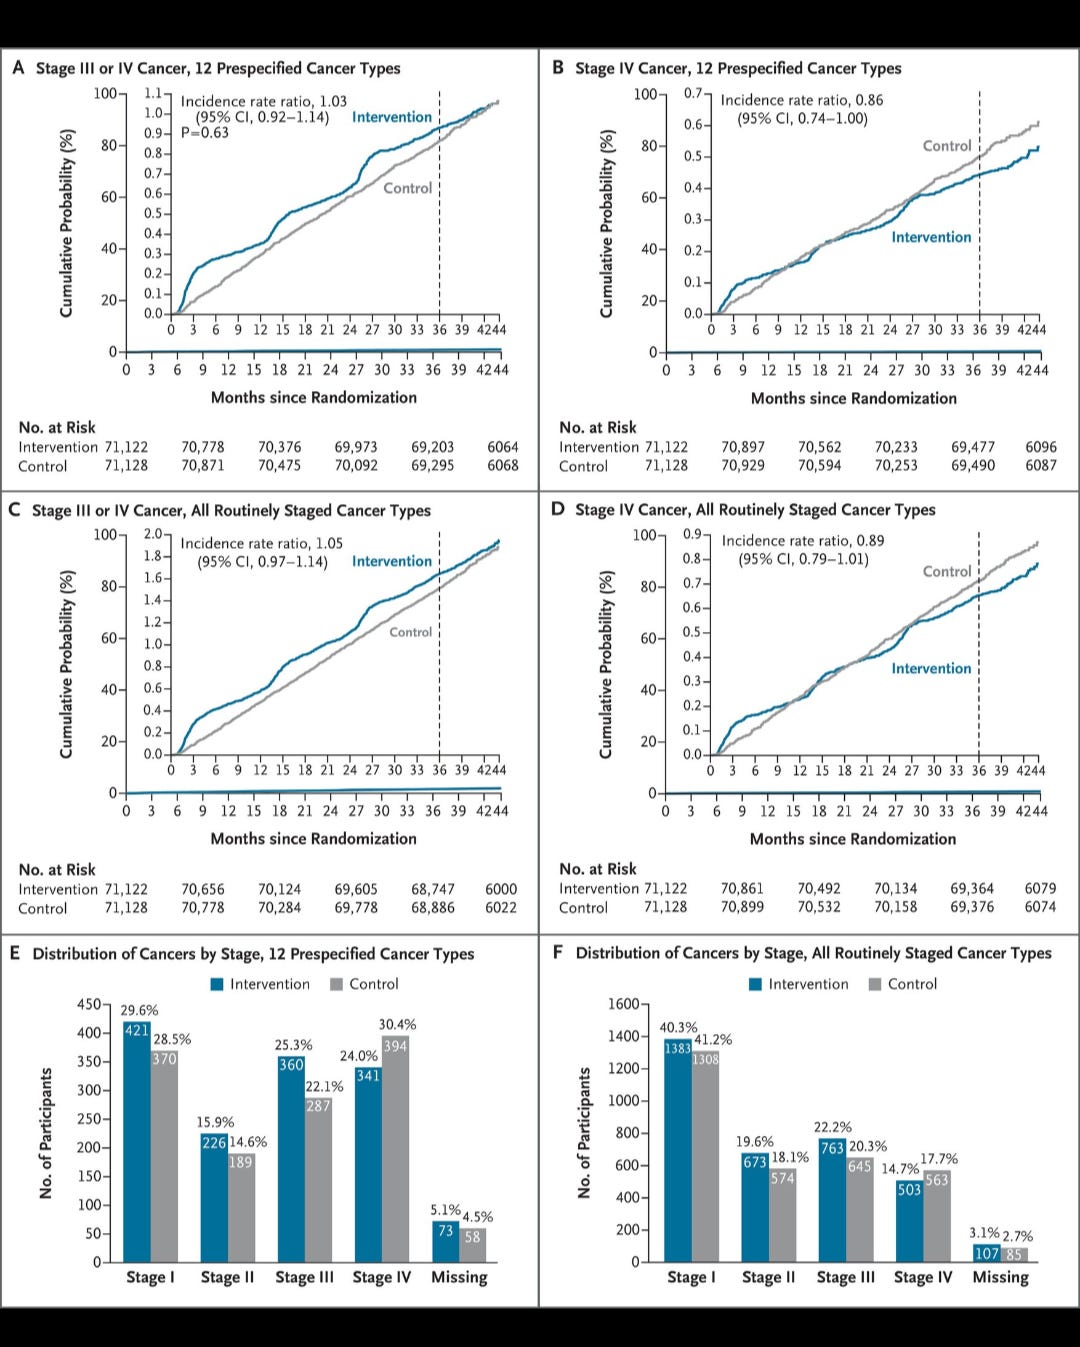
The primary endpoint is 1.03 - stone cold negative.
It makes sense that a screening cancer blood test will initially have an excess of advanced disease, as you find stage 4 disease that is not otherwise clinically apparent.
It makes sense that there would be convergence in subsequent rounds.
But what doesn’t make sense is that the curves would get closer at 35 months, furthest at 39, closer at 44. And missing stage would be imbalanced between arms?
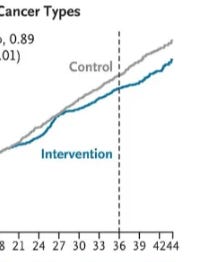
Also there is a difference between what readers think the figure means and what the figure means.
There are 2 ways to have metastatic cancer
You can be diagnosed initially with Stage IV disease. (A)
You could be diagnosed initially with I-III, and later get mets. (B)
Readers think the graph is showing the sum of these two things (A+B), but it is showing A only.
What K-M can help us?
A time to bone mets or mets graph. (B)
(This should show a separation like Panel D)
A death from cancer graph.
An all cause mortality graph.
Secondary endpoints can help tell a story, just like circumstantial evidence can convict a criminal— but only if the detective is impartial, unbiased, and skeptical— otherwise you might convict the wrong person.
Please just say the mRNA covid vaxxes should be banned immediately. Please.